Despite global food production being adequate to meet demand more people died of hunger, or hunger related diseases, than died of AIDS, malaria and tuberculosis combined.
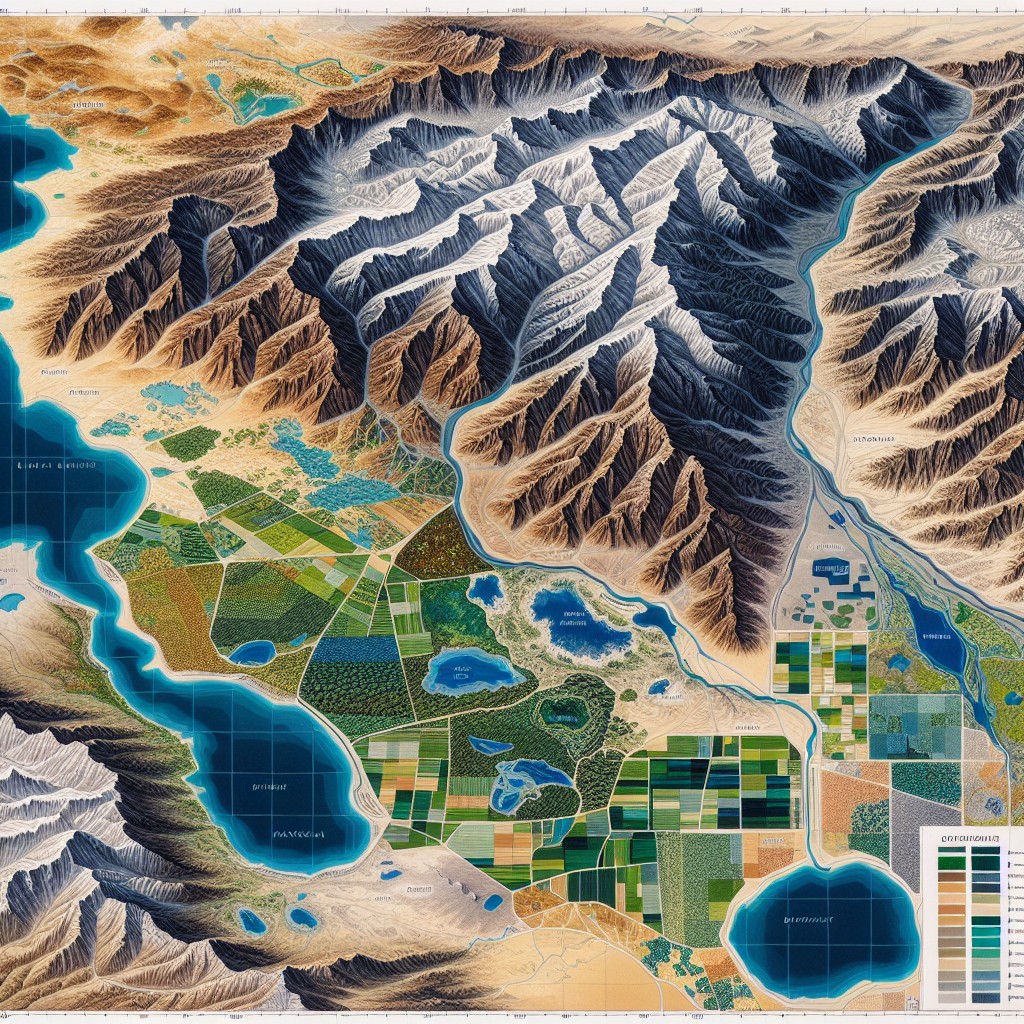
Interactive Map of Global Food Production
Global Food Production
According to the World Food Programme the global food production is enough food to feed our 7 billion population (1) which through improved techniques has seen a 17% increase in food per person in the last 30 years (according to Oxfam). The increased use of fertilisers and improved irrigation has been responsible for a 70% increase in yield of crops in recent years. But this apparent abundance of food is not likely to last. Population growth, globally, has remained steady since 1975 with the addition of 1 billion every 12 years since then reaching 7 billion in 2011.
The Food and Agriculture Organisation (FAO) predict that if global populations reach 9 billion (which, based on current population growth, is more likely to be 10 Billion) we will need to 60% more food (taking into account wastage etc). This may prove an impossible task if the populations eating habits and production methods don’t change dramatically.
As populations rise the need for more urban land to house them is reducing the amount of agricultural land available. Additionally the demand for certain foods like meat require more land not only to be used to raise cattle but also land to grow the grain to feed them. It is believed that only 43% of cereal produced is used for direct human consumption while the remaining 47% is used to feed cattle or lost through waste.
Interactive Map of Global Food Production
Food production index (2004-2006 = 100) – Food production index covers food crops that are considered edible and that contain nutrients. Coffee and tea are excluded because, although edible, they have no nutritive value. (Data from the Food and Agriculture Organization)
Crop production index (2004-2006 = 100) – Crop production index shows agricultural production for each year relative to the base period 2004-2006. It includes all crops except fodder crops. Regional and income group aggregates for the FAO’s production indexes are calculated from the underlying values in international dollars, normalized to the base period 2004-2006. (Data from the Food and Agriculture Organization)
Livestock production index (2004-2006 = 100) – Livestock production index includes meat and milk from all sources, dairy products such as cheese, and eggs, honey, raw silk, wool, and hides and skins. (Data from the Food and Agriculture Organization)
Food Imports (US$) – Calculated using the percentage of imported food merchandise from the nations entire merchandise import value in US$ (Data from the Food and Agriculture Organization)
Food exports (% of merchandise exports) – Calculated using the percentage of exported food merchandise from the nations entire merchandise export value in US$ (Data from the Food and Agriculture Organization)
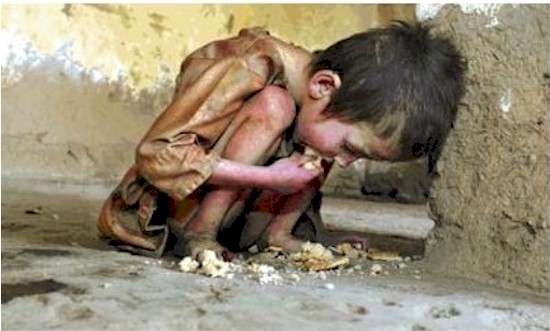
Despite global food production being adequate to meet demand (1), the World Food Programme state that in 2013 more people died of hunger, or hunger related diseases, than died of AIDS, malaria and tuberculosis combined (2). A 2014 report by the Food and Agricultural Organisation claims that there were 805,000,000 chronically undernourished people throughout the world (3) (around 11% of the world’s population).
As remarkable as it may seem this number has been greatly reduced in the last 20 years. In 1992 the number of chronically undernourished people in the world was 1.014 billion (3) which were around 20% of the worlds 5.5 billion population.
Of the 805 million chronically undernourished people – 526 million live in Asia and the pacific, 227 million live in Africa, 37 million live in Latin America and the Caribbean with the remaining 15 million living in ‘developed countries’ (3).
Sources:
- http://www.wfp.org/hunger/causes
- http://one.wfp.org/policies/introduction/other/documents/guide_winning_hunger/ENG/home.html
- http://www.fao.org/publications/sofi/en