Since the last catasphrophic event that hugely affected global population some 70,000 years ago it took the human race until 1804 (69,800 years)to reach a population of 1 billion and only 211 years to grow to 7 billion.
Global Population Interactive Data Map
Life expectancy Interactive Data Map
Factors that affect Life Expectancy
Global Population Demographics Interactive Map
World Human Population
|
Year (at the start of)
|
World Population total
|
World Population Growth (%)
|
Percent of Population Aged 0-14 |
Percent of Population Aged 15-64 |
|
2013 |
7,124,543,962 |
1.16 |
26.31 |
65.75 |
|
2012 |
7,043,105,591 |
1.127 |
26.415 |
65.756 |
|
2011 |
6,964,638,027 |
1.179 |
26.548 |
65.716 |
|
2010 |
|
1.172 |
26.712 |
65.638 |
|
2009 |
6,803,742,004 |
1.18 |
26.905 |
65.521 |
|
2008 |
|
1.188 |
27.127 |
65.365 |
|
2007 |
6,645,716,553 |
1.184 |
27.385 |
65.170 |
|
2006 |
6,567,959,806 |
1.198 |
27.683 |
64.935 |
|
2005 |
6,490,176,815 |
1.211 |
28.024 |
64.663 |
|
2004 |
6,412,516,968 |
1.222 |
28.412 |
64.353 |
|
2003 |
6,335,086,088 |
1.235 |
28.841 |
64.009 |
|
2002 |
6,257,804,216 |
1.259 |
29.295 |
63.646 |
|
2001 |
6,180,015,757 |
1.278 |
29.750 |
63.280 |
|
2000 |
6,102,001,950 |
1.311 |
30.187 |
62.925 |
|
1999 |
6,023,047,888 |
1.347 |
30.599 |
62.588 |
|
1998 |
5,943,024,724 |
1.383 |
30.986 |
62.269 |
|
1997 |
5,861,934,009 |
1.418 |
31.344 |
61.975 |
|
1996 |
5,779,968,275 |
1.439 |
31.670 |
61.713 |
|
1995 |
5,697,950,314 |
1.490 |
31.960 |
61.488 |
|
1994 |
5,614,317,064 |
1.492 |
32.214 |
61.301 |
|
1993 |
5,531,794,369 |
1.535 |
32.430 |
61.155 |
Use the global population interactive data map below for more information about each country’s population records for the last 50 years. All data sourced from the World Bank – a trusted source for many governments and institutions around the world. The interactive map allows you to easily find and compare data about countries population statistics from 1960 until the most up to date records (currently 2013). This feature requires flash which currently is not supported by Apple or Android systems. It can be activated however (see:http://www.pcadvisor.co.uk/how-to/google-android/3417930/install-flash-on-android-kitkat-smartphone-tablet-lollipop/ ) or you can use a windows pc to use this feature.
Global Population Interactive Data Map
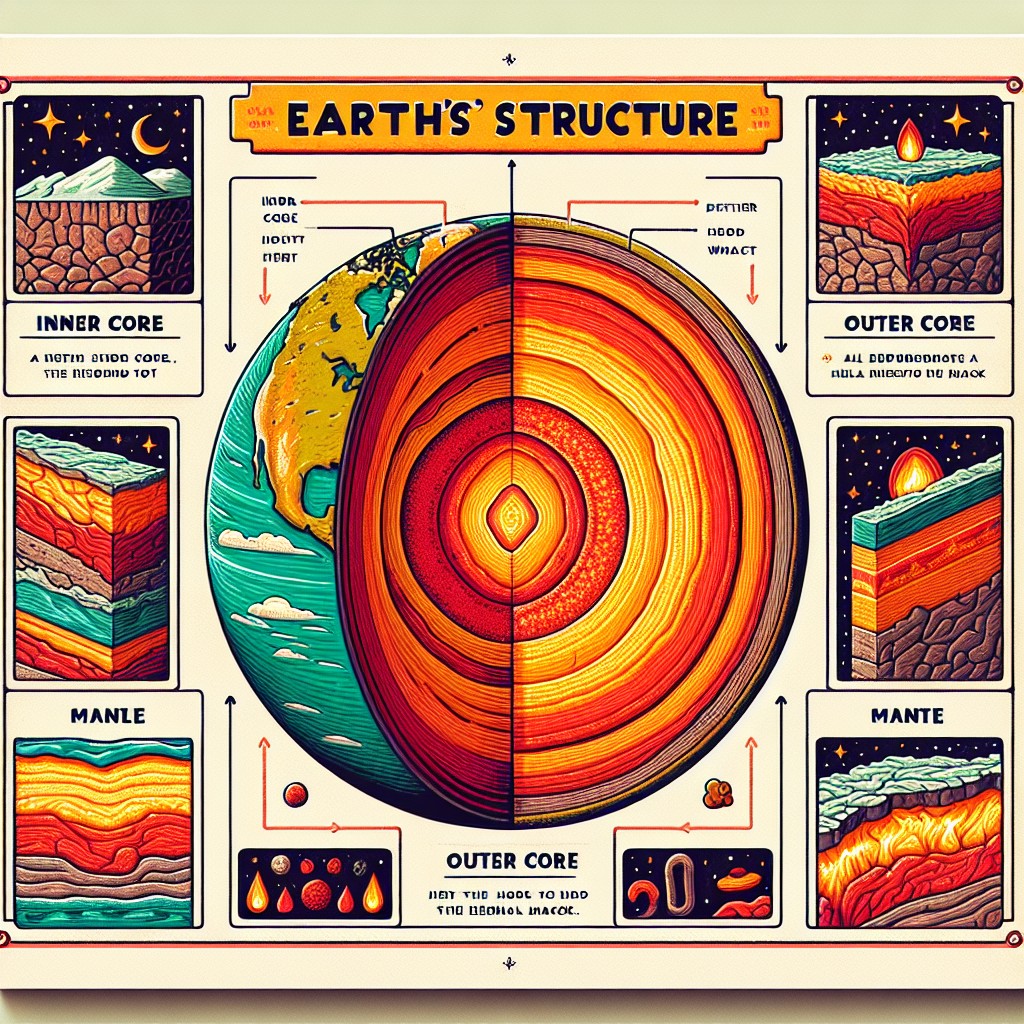
Origin of Humans
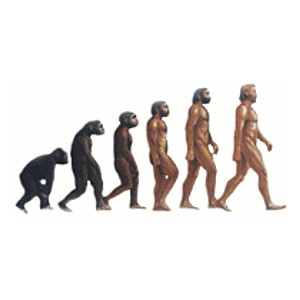
Most scientist agree that our early ancestors, Homo-Erectus, first appeared on the Earth around 1.6 million years ago, with the earliest fossil evidence proving that modern Homo-sapiens existed at least 200,000 years ago in Ethiopia.
The cells of all animals (and other eukaryotic life forms) contain mitochondria which contain their own type of DNA known as mitochondrial DNA. This can be used to trace back lineages through the maternal line only and in 1987 scientist began tracing back human origins to find the original ’Eve’. Their investigation showed that the first female human lived around 200,000 years ago. Initially a similar study to find the first ‘Adam’, through the Y chromosome, traced the first men to 100,000 years ago. Obviously this caused a problem for it suggested that women lived and bred for a 100,000 years without man.
Thankfully our understanding and techniques of DNA sequencing progressed so when a new study was carried out in 2013, using 7,000 previously unknown markers, it allowed scientists to trace ‘Adam’ to around 200,000 years ago (the same period as ‘Eve’). (Source: http://www.nature.com/news/genetic-adam-and-eve-did-not-live-too-far-apart-in-time-1.13478 )
We can therefore, with some accuracy, state that human life began around 200,000 years ago.
Extinction Events
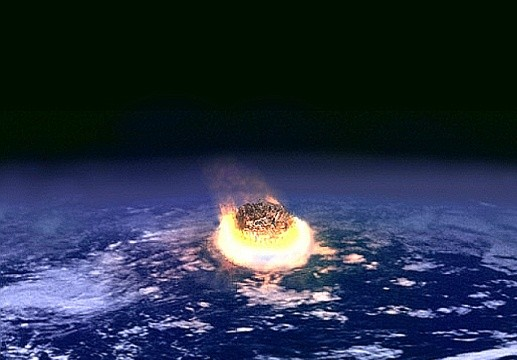
Additionally studying the mitochondrial DNA can show bottlenecks in global population. This indicates low numbers of that species due to the sudden drop in diversity of the DNA. This could be due to many reasons such as famine, war or natural disasters.
Geologists have found evidence of many natural disasters such as volcanic eruptions, earth quakes, tsunamis and the impact of objects from space. These events can be calculated using radioactive dating and they have discovered many such catastrophic events throughout history. One very famous catastrphe is the K-T event when a meteor or asteroid struck the Yucatan Peninsula around 66million years ago killing the Dinosaurs. This type of event is what is known as a mass extinction event and there have been others since then, some of which during the time of man.
Around 70,000 years ago, geological evidence shows, that a super volcanic eruption took place on the small island Sumatra in Indonesia. The Toba Volcano produced the largest eruption on Earth in the last 2 million years and believed to have caused a drop of the mean surface temperature by 3 to 5 degrees which if correct may have caused the last glacial period or ice-age. This event coincides with a bottle neck in human population with evidence suggesting the global population of the human race was around just 2,000 members. According to the “Toba Catastrophe Theory” the eruption and subsequent volcanic winter had a dramatic affect on the lack of diversity in humans and almost wiped out our entire species.
If we take the origin of humans to be about 200,000 years ago it would mean that the human race had 130,000 years of growth and diversity which was almost reset around 70,000 years ago.
Reaching 7 Billion
|
Year
|
Population
|
Years taken for next increase |
|
68,000BC |
2,000 |
58,000 |
|
10,000BC |
1,000,000 |
10,000 |
|
1AD |
200,000,000 |
1,650 |
|
1650 |
500,000,000 |
154 |
|
1804 |
1,000,000,000 |
123 |
|
1927 |
2,000,000,000 |
33 |
|
1960 |
3,000,000,000 |
15 |
|
1975 |
4,000,000,000 |
12 |
|
1987 |
5,000,000,000 |
12 |
|
1999 |
6,000,000,000 |
12 |
|
2011 |
7,000,000,000 |
? |
Thankfully no such extinction event has happened since and thanks to the resourcefulness of mankind we not only survived but flourished
It is suggested that around 12,000 years ago global population reached 1 million but this is obviously very difficult to be exact. If we take the population bottleneck which happened 70,000 years ago as a starting point then it took roughly 58,000 years for humans to reach its first million and only another 69,804 years to reach one billion. Since reaching that first billion the global population growth has seemed unstoppable despite the many wars (with 114,216,407 dead), famines (44,320,000 dead), natural disasters (4,195,400 dead) and diseases (1.5 billion dead) the population of the human race has increased to 7 billion in just over 200 years (death tolls based on lowest estimates of major events since 1804 from various sources. The actual amount would be considerably higher)
The global population growth appears, at the moment at least, to be holding steady at the rate of an extra billion every 12 years but even if this lasts our planet will not be able to sustain us for long.
Life expectancy
The average life expectancy in humans used to be 30 years and this remained the same for much of our history. Yet in the 16th and 17th century life expectancy in Britain was raised to around 40. As our understanding of healthcare and hygiene increased so did our life expectancy and by 2010 (for those born in 2010) the average life expectancy around the world rose to 67 (80 in the UK).
One reason for the increase in life expectancy was the improvement of lifestyles and medical knowledge. As you can see from the data above the largest cause of death is due to disease.
Tuberculosis
Tuberculosis (or TB) has been recognised to have reached epidemic levels. According to the World Health Organisation (WHO) 9 million people fell ill with the disease in 2013 and of those 1.5 million died. It is believed that one third of the global population has latent TB meaning that it lays dormant within the host but has not yet made them ill. TB is not spread by those with latent TB but by ill sufferers coughing or sneezing the bacteria into the air. TB is treatable with a six month course of antimicrobial drugs but people not completing the course has led to TB developing resistance to the drugs. 95% of people that die from the disease are from developing countries but efforts co-ordinated by WHO (part of the Millennium Development Goal) have began to reduce the spread of the disease and in 2013 an estimated 37 million lives were saved from Tuberculosis and the death rate is estimated to have dropped by 45% between 1990 and 2013.
People with weak immune systems are most likely to develop TB. This includes those with HIV (TB is the number one killer for those with HIV), malnutrition, Diabetes or those that smoke. 20% of TB cases worldwide are attributed to tobacco use.
Life expectancy Interactive Data Map
Life Expectancy (from Birth) – The average age a person is expected to live till if born in that year.
GDP (Gross Domestic Product) – the value of goods and services produced by that country in a given year. This is an indicator of a countries wealth.
Health expenditure per capita (current US$) – The countries expenditure (in US $) on healthcare divided by its population. A rough indicator as generally healthcare is not spread evenly and in some cases not even available to all occupants.
Access to improved sanitation (% of Population) – percentage of population with access to safe sanitation facilities which include flush/pour flush (to piped sewer system, septic tank, pit latrine), ventilated improved pit (VIP) latrine, pit latrine with slab, and composting toilet. (records for this indicator began in 1990 by WHO and UNICEF in a Joint Monitoring Program (or JMP))
Incidence of tuberculosis (per 100,000 people) – Number of newly diagnosed cases with those in poorer countries more likely to die from the disease and effecting life expectancy (a relatively new indicator with records starting in 1995).
Factors that affect Life Expectancy
There are many factors in the modern world that affect life expectancy. One huge factor is a healthy lifestyle such as eating well, having a clean water supply, hygiene, exercising regularly and not partaking in unhealthy habits such as smoking, taking illegal drugs and or drinking. Dangerous activities such as sports or jobs with a high mortality rate can also have an effect on your life expectancy as can the area you live in (high crime rate areas). Many of the factors mentioned are hugely affected by wealth as is the medical/health care available to a person. This is why many of the countries with high li8fe expectancy is found in wealthier nations but there are other factors.
War obviously has a huge affect on life expectancies of a nation’s population and in general nations with stable governments in a stable region with happy populations will have less chance of war (Although as history has shown any and all nations can be pulled into international conflicts).
Genetic factors also play a large role. It has been known for some time now that the risk of heart disease or cancer can be increased if family members have suffered from the disease. Other diseases are much more likely due to the area or country in which you were born. According to the World Health Organisation (WHO) around half the world’s population (3.4 billion people)are at risk from malaria. There were 207 million cases and an estimated 627,000 deaths in 2012 alone and of these 90% occurred in poor African countries and most of these deaths were children under 5.
(Source: http://www.who.int/features/factfiles/malaria/en/).
Sickle cell is a genetic abnormality which causes red blood cells to form as sickle or crescent shaped cells instead of the more common circular shape. Malaria is a disease which is spread mainly by mosquitoes (but also blood transfusions etc) and the mosquitoes thrive in warm, tropical climates. The mosquitoes spread a parasite when they feed on humans and those parasites attack the red blood cells of the host. It is treatable but if left it can be fatal, particularly to the young and infirm.
Because Sickle cell affects the shape of the red blood cells in those with the disease it prevents them from contracting malaria as the parasite is unable to attach. This gives those with sickle cell a natural immunity to malaria and therefore their survival rate and life expectancy in Africa. Due to this those with sickle cell were able to reproduce which increased the percentage of those with the blood deformity in Africa. This however has its own consequences. Sickle cells cause blockages in blood cells which can prove fatal. Additionally when two carriers of the sickle cell disease reproduce, which is now more likely, their offspring have a higher likelihood of developing sickle cell anaemia to which there is currently no cure and this disease dramatically reduces a person’s life expectancy.
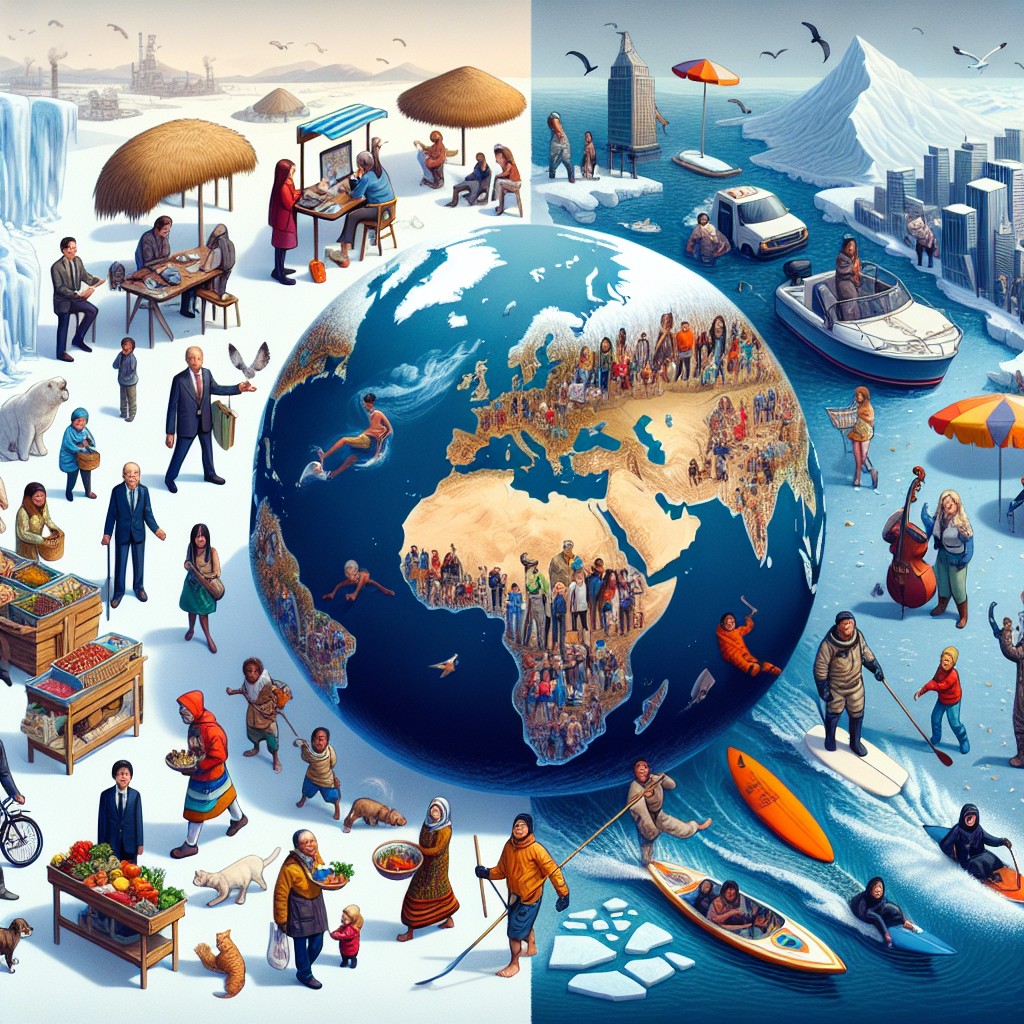
Global Population Demographics
Population demographics is the study analysis of populations by placing them in certain groups. This can be useful in predicting the behaviour of a population and predicting any possible problems with population growth in the future. The population of a species gives us fairly limited information (the number of that species in a given area) but the addition other information about that population such as life expectancy, percent of males etc can help us see and predict the future of that species. The life expectancy interactive map above contains many of indicators associated with population demographics but there are many others.
Population demographics of humans also aids in other aspects of our life such as marketing and therefore commerce. Due to this the study of demographics in human populations is much more in-depth than with that of another species.
Global Population Demographic Interactive Data Map