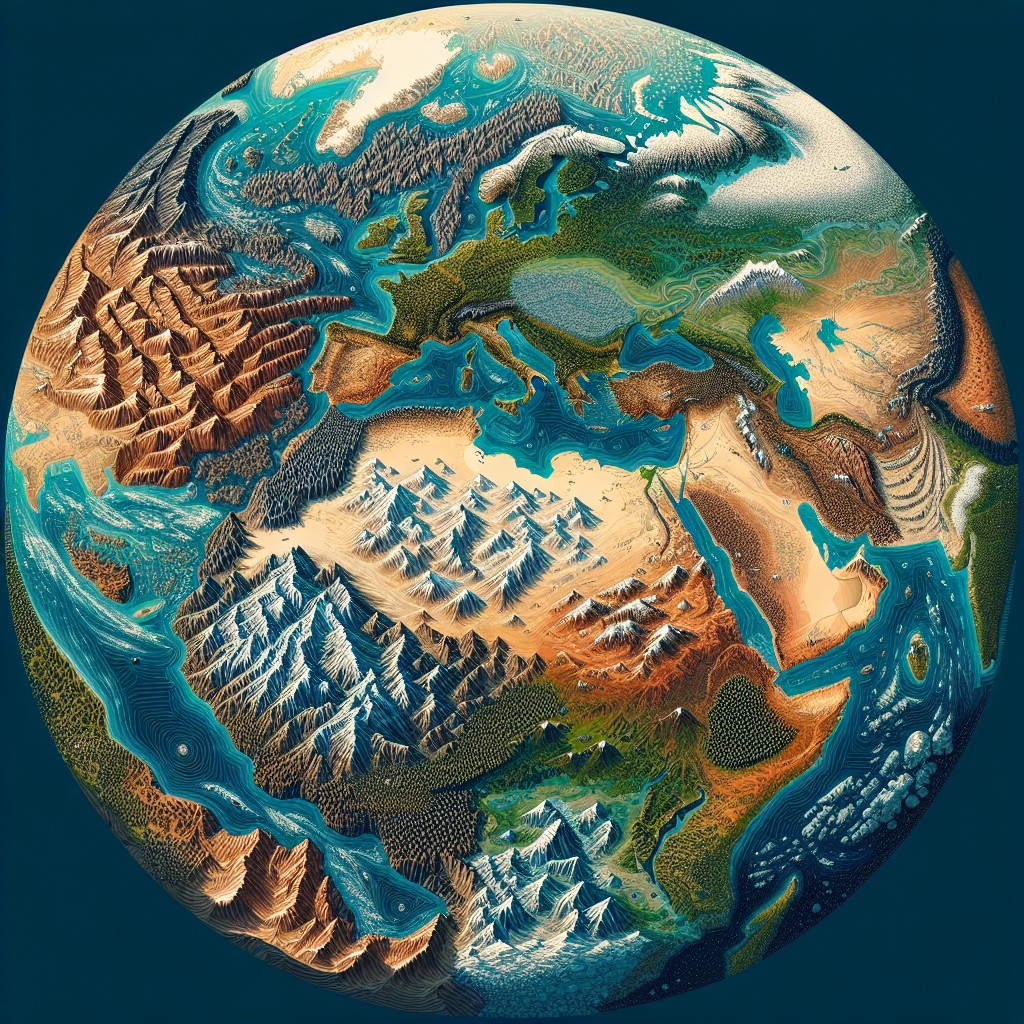
Geographical land use is an article discussing the environmental features on Earth and how humans have adapted the environment to meet their requirements
Additional Effects of Urbanisation
Interactive World Map of Land Use
Geographical Land Use
Life on earth has evolved and adapted to suit their environment and continues to do so. This has been known for centuries, long before Charles Darwin took his famous journey, but what Darwin showed us was the mechanism by which this adaptation occurs. It is naturally occurring mutations that either benefit or hinder an animal’s survival and reproduction that determines if that mutation survives and in the case that it does a new better equipped sub-species is born.
Public domain image of a termite mound
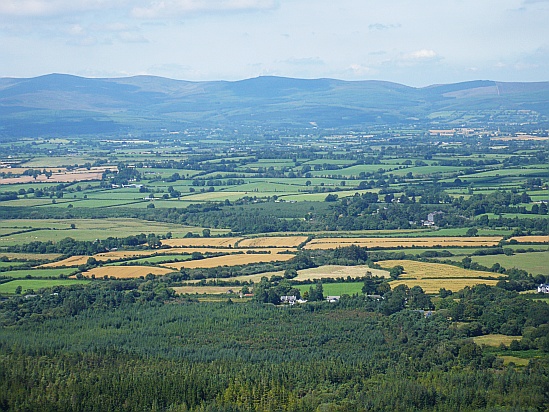
However amazing and intricate these adaptations have become none are perfect and in a world with an ever changing environment most animals adapt their own habitat to some degree in order to aid their survival. From burrows to nests all are made from the surrounding resources perfectly designed for their inhabitants.
Humans have taken this adaptation of the environment to new levels allowing them to live in almost any location on the earth and live with comforts beyond the comprehension of all other species. This has come at some cost to the planet but this topic is discussed in the world pollution section. This article about geographical land use is concerned with how we have adapted the face of the planet to meet the enviromental challenges that exist on Earth.
Urban land
Public Domain – Part of Tokyo the world’s most populated city with over 38 million inhabitants.
Nowhere is the impact of human adaptation of our habitat more evident than in our huge cities. Metal and concrete pulled from the earth totally changing the landscape and in many cases the sky line. Urbanisation – the concentration of population in specific areas creating towns and cities – has increased significantly in the last hundred years. According to data from the United Nations in the 1950’s only 30% of the world’s population lived in urban areas but as of 2014 more than half the world’s population (54%) are urbanised. 12.5% of the world’s population (over 560,000,000 people) live in one of the worlds 28 mega cities ( a city with a population over 10 million). The UN also predicts that by 2030 there will be 41 of these mega-cities globally and by 2050 two-thirds of the world’s population will be urbanised. Currently it is believed that around 80% of the populations of North and South America live in urban areas (82% in the US and Canada), while Europe has 73% urbanised. Africa has around 40% while Asia is 48% but the growth of urban populations in both of these continents is growing far more rapidly than the rest of the world.
The statistics of urban/rural population is not an indicator of the geographical land use of a country but it is a good indicator of how countries may develop in the future. According to the Office for National Statistics (ONS) the United Kingdom is generally considered to have a rural landscape with only a third of land considered to be urban despite 60% of its population (around 80% in England) living in urban areas. Increased demand for properties in major cities however is causing them to grow and slowly envelop more and more rural land.
See the Interactive Data Map of Geographical Land Use below for data on individual countries (only available on desktop version).
Advantages of Urbanisation
Improved Facilities
Living in towns and cities bring improved facilities to its inhabitants such as better hospitals, more policing etc and better infrastructure such as roads to improve access to these facilities. The improved infrastructure also provides its inhabitants with more reliable utilities such as gas, electricity, water and sanitation that improves the health of its inhabitants (not applicable in slums).
Improved Tourism
Improved infrastructure is very attractive to tourism and this can be a very large source of wealth for a country. Tourism brings money for hoteliers, restaurants, to transport shops etc.
Improved Industry
The need for housing and infrastructure requires intense building providing work for craftsman and those that work in producing the raw materials required such as still, concrete, glass and all the piping and cabling and fixtures etc. The large population provides more need for restaurants etc and other jobs within the service industry.
Improved economy
The improved tourism, industry and jobs boost the economy of the entire nation as well as the attraction to big business and foreign investment.
Improved Education
Large populations require larger schools, colleges and universities which generally receive more money due to numbers and are able to improve facilities. Additionally the culmination of large populations allows leaders in their field to meet and discuss their particular subject which generally leads to advancements
Problems with Urbanisation
Increased Poverty
Huge populations compressed into small areas causes increased demand for housing and services. As demand for housing increases both buying and renting prices increase and only the wealthiest can afford to live in these areas. But because demand for work in big cities remains high cheaper sub-standard housing is erected and this produces slums usually found on the outskirts or ‘suburbs’ of major cities.
Although an increased population creates more demand for jobs in the service trade and many businesses are situated in these areas creating more jobs the population normally increases way above the demand for work and this causes huge unemployment figures in urban areas. Higher unemployment creates more demand for cheap housing and slums continue to grow. Forced to live in these slums in the suburbs where availability of jobs is lower decreases chances of future employment. Reduced wealth and hope may then lead to certain antisocial activities and an increase in crime.
Increased Crime
Crime rates are higher in urbanised areas. Crime rates measure the frequency of crime per a certain number of people which accounts for the increased populations in urban areas.
One factor in a rise of crime in urban areas is due to less police activity in slum areas allowing more criminal activity to occur unimpeded. Despite this there is an increase in crime rates in urban areas of developed countries where police presence is high. In the United Kingdom police surveillance in urban areas is much higher than in rural due to increased numbers in police personnel and the huge network of CCTV surveillance.
In the United Kingdom between 2012/2013 data suggested that in urban areas 12.3 out of every 1,000 had experienced violent crime (1.23% of urban populations) while in rural areas 7.2 out of every 1,000 people had experienced violent crime (0.72 % of rural populations). This difference in crime rates shows a similar pattern across all types of crime with the rates increasing with the size of the cities in the UK suggesting that crime in general is higher in cities despite increased policing.
Decreased Health
The air quality in urban areas is often worse than found in urban environments and this leads to a higher number of people with chronic disease such as asthma. Although in richer cities many gyms are available there is often less facilities in Urban environments of poorer nations leading to inhabitants having less exercise. Even in wealthier cities memberships to gyms are a luxury many cannot afford.
The slums of many major cities lack basic sanitation leading to widespread disease and without access to medical facilities the inhabitants have low survival rates. The spread of infectious disease would be hugely increased in cities making an outbreak much harder to contain but modern transport and globalisation are also important contributing factors in such outbreaks.
Decreased Agriculture
The growth of cities takes up land that would otherwise be available for agriculture. Additionally with more people moving into cities decreases the amount of people available to perform agricultural work.
Additional Effects of Urbanisation
The temperature in cities is normally higher due to many contributing factors. The concrete and metal of the landscape absorbs the heat energy from the sun while vegetation in rural areas uses much of this energy for the process of photosynthesis. Additionally the tall buildings trap the heat which would otherwise be dispersed by winds.
Rural Land
Rural land is any land that has not been developed into urban land (towns and cities). Originally all land was rural with pockets of agricultural land used to support the small populations. As populations have grown and villages became towns and cities much of the rural land was required to support the growing urban populations. Today nearly all rural land is used for agriculture supporting the huge urban population that now dominate the globe. The majority of rural land not being used for agriculture is woodland, desert or used for industry such as mining etc. According to the World Bank as of 2008 less than half of the world’s population live in rural land and as of 2013 rural populations dropped to 47%. Simultaneously in 2008 the amount of land designated for agriculture globally was only 37.8% and global agricultural land continues to diminish. These growing urban populations combined with the loss of agricultural land are making it difficult to grow enough food to feed everyone.
Agricultural Land
Agricultural land is land that is used for the production of food. This can be in the form of crop production (arable land), animal rearing for meat or dairy production.
See the Interactive Data Map of Geographical Land Use below for data on individual countries (only available on desktop version).
Arable Land
Arable land is land used for temporary or permanent crops. This includes the cultivation of all crops such as wheat, fruit and vegetable etc and fields temporarily unused for farming. Fields that have not been farmed for more than a five year period are no longer considered arable land. The amount of arable land throughout the world fluctuates due to growth of cities, environmental conditions such as droughts etc, or economic factors such as farmers unable to finance upkeep of the land (irrigation etc).
See the Interactive Data Map of Geographical Land Use below for data on individual countries (only available on desktop version).
Woodland
Public Domain Image of Nightcap National Park Rainforest
Woodland is generally kept for the supply of timber (trees kept for food production like fruit trees is classed as arable land) but due to human attempts to reduce CO2 emissions many countries are encouraged and paid by the international community to keep woodland.
In 1947 the Food and Agricultural Organisation was founded and tasked with providing technical data regarding world food and agricultural production to aid the International Red Cross. The agricultural segment soon included fisheries, and forestry information and the department for Global Forrest Resource Assessment (known as the FRA) began. Data the collected showing the percent of land which is forest area is available since 1990 and this shows that globally the amount of forest has fluctuated between 30% and 31% of the global land mass.
See the Interactive Data Map of Geographical Land Use below for data on individual countries (only available on desktop version).
Deserts
Desert land can form due to many factors but the most important factor is how arid the region is. Land is determined to be arid if the average yearly precipitation (rainfall) is insufficient to account for the loss of moisture from natural evaporation and transpiration (transpiration is the process whereby moisture from the soil is absorbed by the roots, transported through the plant and released into the atmosphere through minute holes in the plant mainly found on the leaves). The calculation used to measure aridity is the Aridity Index which is ratio between the two figures P/PET (where P is precipitation and PET is the Potential Evapo-transpiration (potential evaporation and transpiration combined if vegetation existed). Arid land is considered to be land where rainfall is less than 20% of the water required to account for Potential Evaporation and Transpiration or have an Arid Index of 0.20 or less.
The United Nations Environmental Programme (UNEP) has a specific department – the Global Desert Outlook (GDO) – to measure the fluctuating deserts of the world. Data released by the GDO states that around 17.6% of the world’s land mass is arid with 12.1% considered arid, with an arid index between 0.05-0.2, while 7.5% is considered Hyper-arid with an arid index of <0.05.
How Are Deserts Formed?
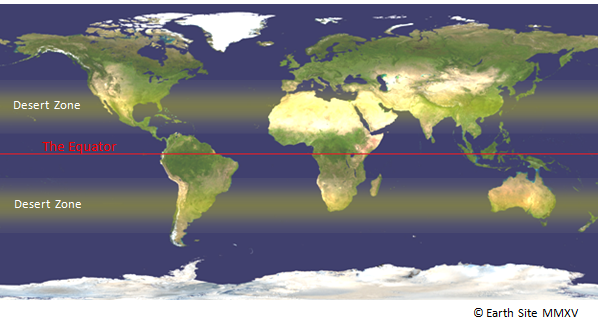
As you can see from the satellite image the world’s desert land appears to form in two banded areas – between 15-35˚ North and South lines of latitude – above and below the equator.
See the Interactive Data Map of Geographical Land Use below for data on individual countries (only available on desktop version).
Convection Cells
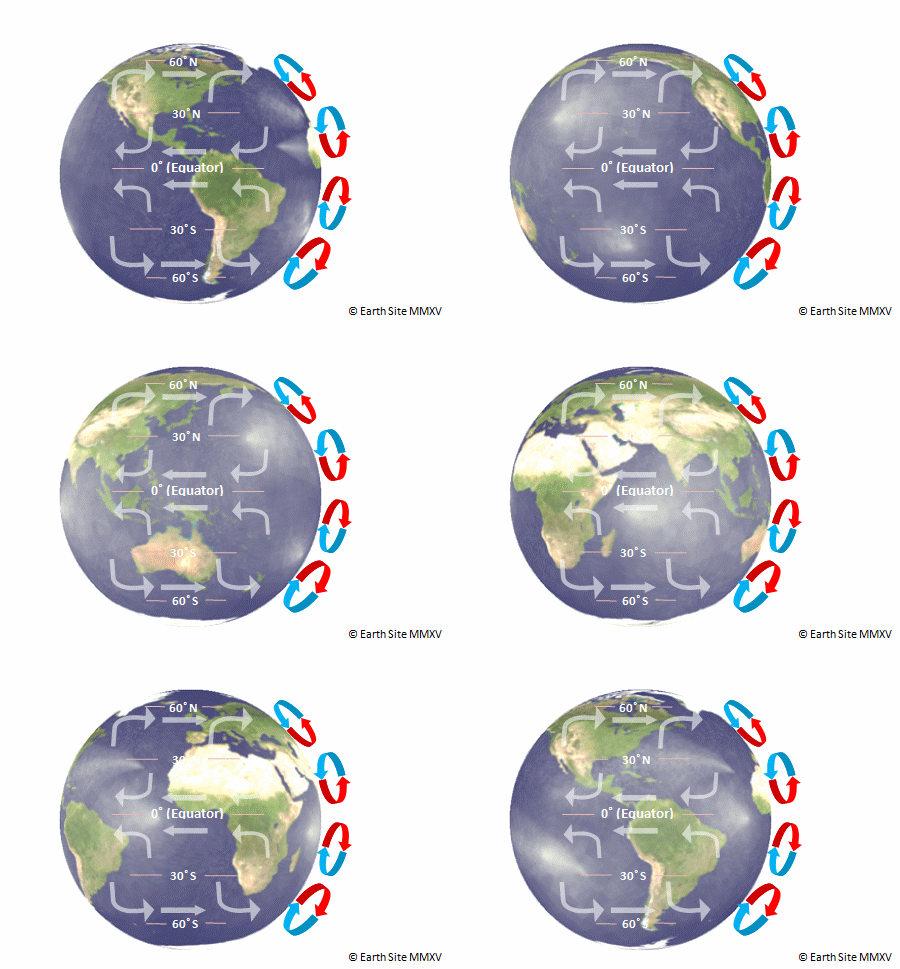
Because the earth’s equatorial line points directly towards the sun the air in the atmosphere above the equator absorbs more heat than anywhere else on Earth.
The heated air at the equator is drawn up into the atmosphere which creates increased air pressure pushing against colder air found towards the poles. As the previously heated air from the equator reaches the colder Polar Regions it cools and falls towards the earth’s surface. This cooler air is then forced towards the equator by the rotation of air in the upper atmosphere which creates a circular motion of wind. This convection process driving the winds is known as Convection Cells.
This on its own would cause more evaporation at the equator and as the air rises in the atmosphere it cools causing the water vapour to condense and rain to fall. All this would take place at or very near to the equator and with all the water vapour falling at the equator there would be none left to fall across the rest of the planet. The landscape of the earth would look very different with vegetation able to grow only across the equator and the rest of the world towards the poles becoming increasingly arid. But this is not the reality of the planet thanks to its spin which causes the Coriolis Effect.
The Coriolis Effect
This new configuration of convection cells and wind directions caused by the earth’s spin changes the pattern of rainfall across the globe. Again moisture is evaporated mainly at the equator and released once it reaches high altitude but the addition of high pressure caused around 30˚ North and South of the equator also drives away any rain clouds around these bands. These combined effects are the main cause for the two distinct bands of the arid land seen on the globe. The band in the north is much larger than the southern band due only to the difference in land mass in the two hemispheres.
The Atacama in Chile, the Namib and Kalahari in southern Africa and the Western Australian desert are actually cold but arid landscapes caused by cold air from ocean currents that draw away moisture rich air from their coastlines.
Rain Shadow
Adapted and released into the public domain by Earth Site
This is a phenomenon whereby rain clouds that pass high mountains are obstructed or forced to release their cargo. This prevents rain from falling on the land on the other side of the mountain causing arid land to form. Examples of deserts created by rainshadow are the central and eastern Australian deserts.
Interactive World Map of Geographical Land Use
Land area (sq. km) – Land area is a country’s total area, excluding area under inland water bodies, national claims to continental shelf, and exclusive economic zones. In most cases the definition of inland water bodies includes major rivers and lakes. (Data from the World Bank) Data used in Geographical Land Use interactive Map.
Rural population (% of Total Population) – Rural population refers to people living in rural areas as defined by national statistical offices. It is calculated as the difference between total population and urban population. (Data from the World Bank) Data used in Geographical Land Use interactive Map.
Agricultural land (% of land area) – Agricultural land refers to the share of land area that is arable, under permanent crops, and under permanent pastures. Arable land includes land defined by the FAO as land under temporary crops (double-cropped areas are counted once), temporary meadows for mowing or for pasture, land under market or kitchen gardens, and land temporarily fallow. Land abandoned as a result of shifting cultivation is excluded. Land under permanent crops is land cultivated with crops that occupy the land for long periods and need not be replanted after each harvest, such as cocoa, coffee, and rubber. This category includes land under flowering shrubs, fruit trees, nut trees, and vines, but excludes land under trees grown for wood or timber. Permanent pasture is land used for five or more years for forage, including natural and cultivated crops. (Data from the World Bank) Data used in Geographical Land Use interactive Map.
Forest area (% of land area) – Forest area is land under natural or planted stands of trees of at least 5 meters in situ, whether productive or not, and excludes tree stands in agricultural production systems (for example, in fruit plantations and agroforestry systems) and trees in urban parks and gardens. (Data from the World Bank) Data used in Geographical Land Use interactive Map.

